Article
Multi-Wave Reporting
Multi-wave reporting lets you combine results from multiple surveys within the same project into a single report. This is ideal for tracking changes over time, running ** longitudinal studies**, or simply consolidating data for easier analysis.
Rather than looking at each survey individually, multi-wave reporting gives you a unified dataset with statistical testing run across all waves combined, while still allowing you to see results for each wave separately.
Key Features
- Cross-survey reporting – Pull data from multiple surveys in the same project into one report.
- Custom wave labels – Assign labels like “Wave 1,” “Wave 2,” etc., or stick with the survey names.
- Flexible filtering – Add the wave label as a column, row, or filter in your report.
- Statistical testing on combined data – All testing is run against the aggregated dataset.
- Automatic code frame matching– Any open-ended question repeated across surveys in the same project uses the same code frame automatically.
Creating a Multi-Wave Report
1. Navigate to the Projects Page
From your main dashboard, open the project containing the surveys you want to combine and selec the reports tab:

2. Create a New Multi-Wave Report
Click Create Report
Add the surveys you want to include. You can:
- Keep the default survey name as the label, or
- Enter a custom label (e.g., “Wave 1,” “Wave 2”).
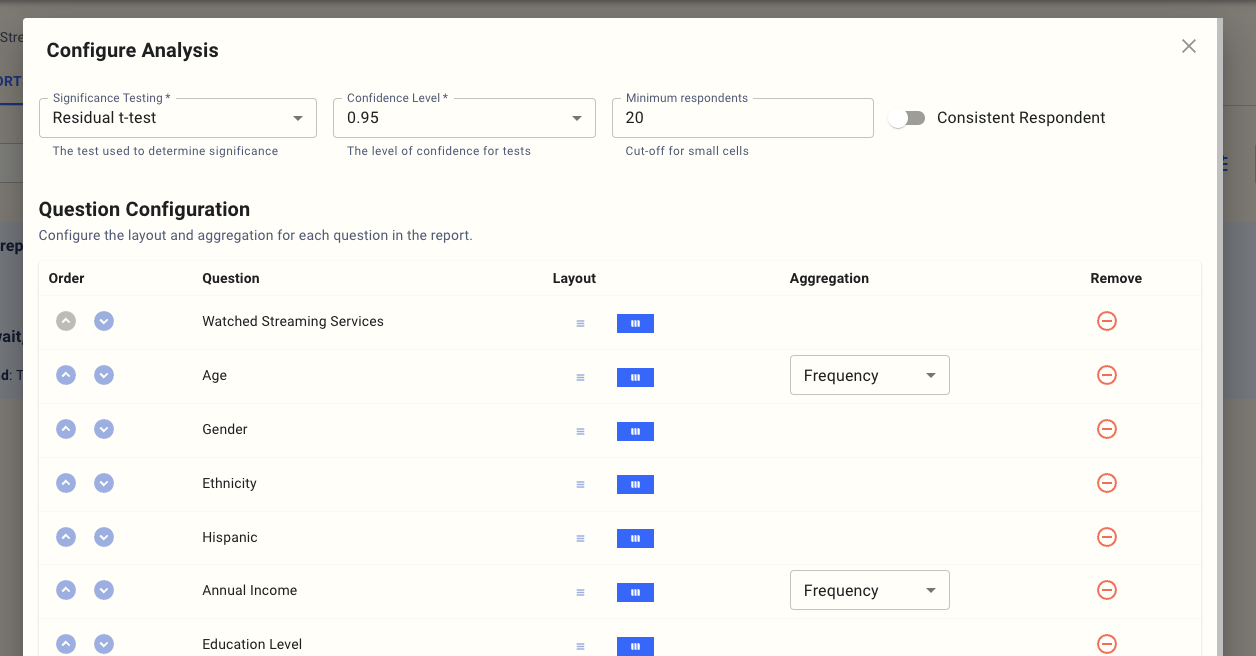
3. Choose Respondent Handling
When setting up a multi-wave report, you can choose how to treat respondents who appear in more than one wave in the analysis page:
- Consistent Respondent – Treats the same respondent across waves as a single individual for longitudinal analysis.
- Separate Respondents – Treats responses in different waves as independent entries.
You can configure this in the analysis screen for each report:
5. Build and Analyse Your Report
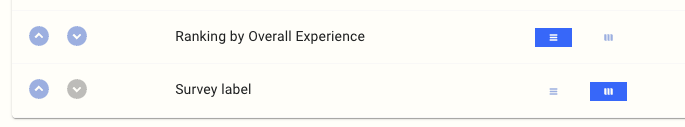
Once your surveys are added, you can insert the wave label as:
- A column- A ** row**- A ** filter**
Your analysis will automatically apply statistical testing across the combined dataset.
Best Practices
- Use clear wave labels (especially if you have more than two waves) to make reporting more straightforward to interpret.
- When running longitudinal studies, always enable the ** Consistent Respondent** option.
- Remember that open-ended code frames are already unified for repeated questions, so no manual alignment is needed.