
Image-highlighter reports show which areas respondents selected in an ad, package or concept. Compare answers to questions about what they like or find confusing.
First add an image highlighter question and collect simulated or live answers. Use a separate question for each intent. The report combines the selected areas into heatmaps and uses AI-assisted coding to identify named regions of the image.
Create the report
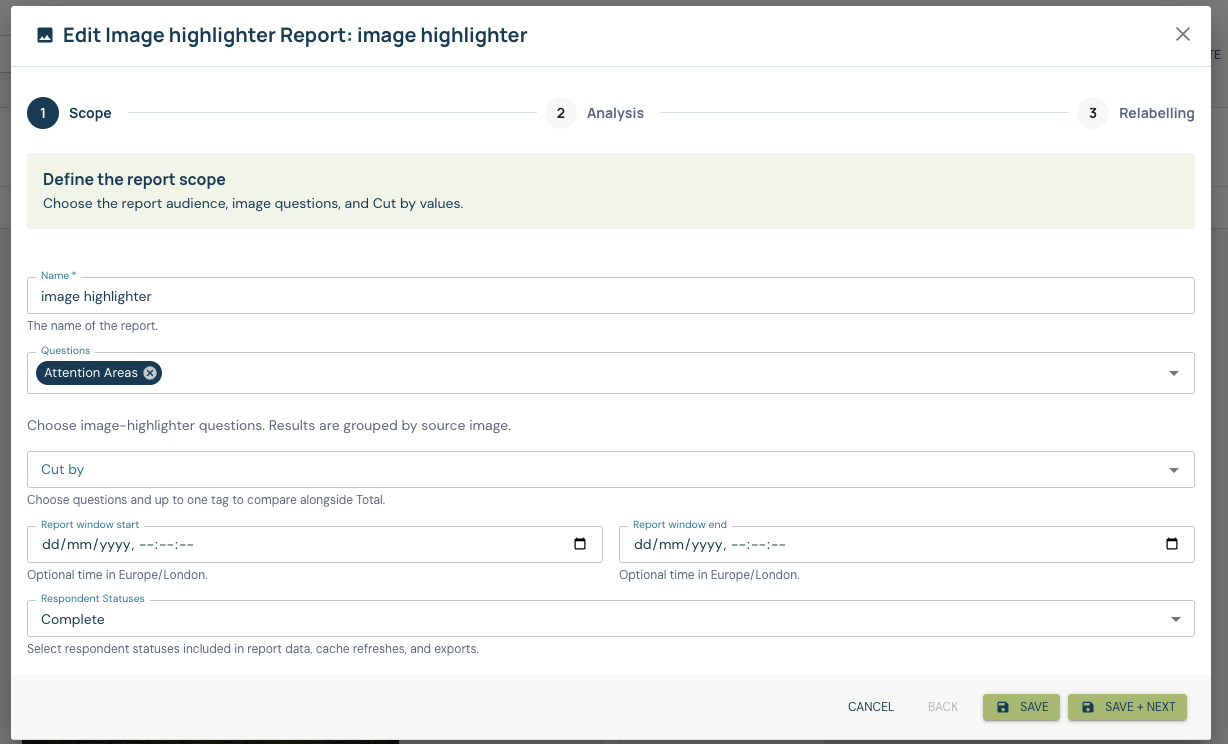
On the survey's Reports tab, choose Create → Image highlighter, name the report and save it. Open Edit to configure its three steps: Scope → Analysis → Relabelling.
- In Scope, choose the respondent statuses and optional report window. Select one or more image-highlighter Questions. Their order is retained, and questions using different source images are grouped into separate image pages.
- Optionally, use Cut by to select the questions you want to compare, such as age group or a demographic answer. You can also select up to one tag. These comparisons appear alongside Total. Project reports also select their source surveys and respondent-ID settings.
- In Analysis, leave Unweighted off to apply survey weights, or turn it on to use raw respondent counts.
- In Relabelling, adjust the displayed question and Cut by labels, and the response labels of the Cut by questions. Save the report.
If no image-highlighter questions are offered, check that they exist in the selected surveys and are available for reporting. Relabelling does not replace the original image or the respondents' selected coordinates.
Read the images
The report shows Original with the named region outlines, then Total and the selected comparison groups. Questions have separate colors, so you can compare different intentions on the same image. Use the question legend to show or hide question layers.
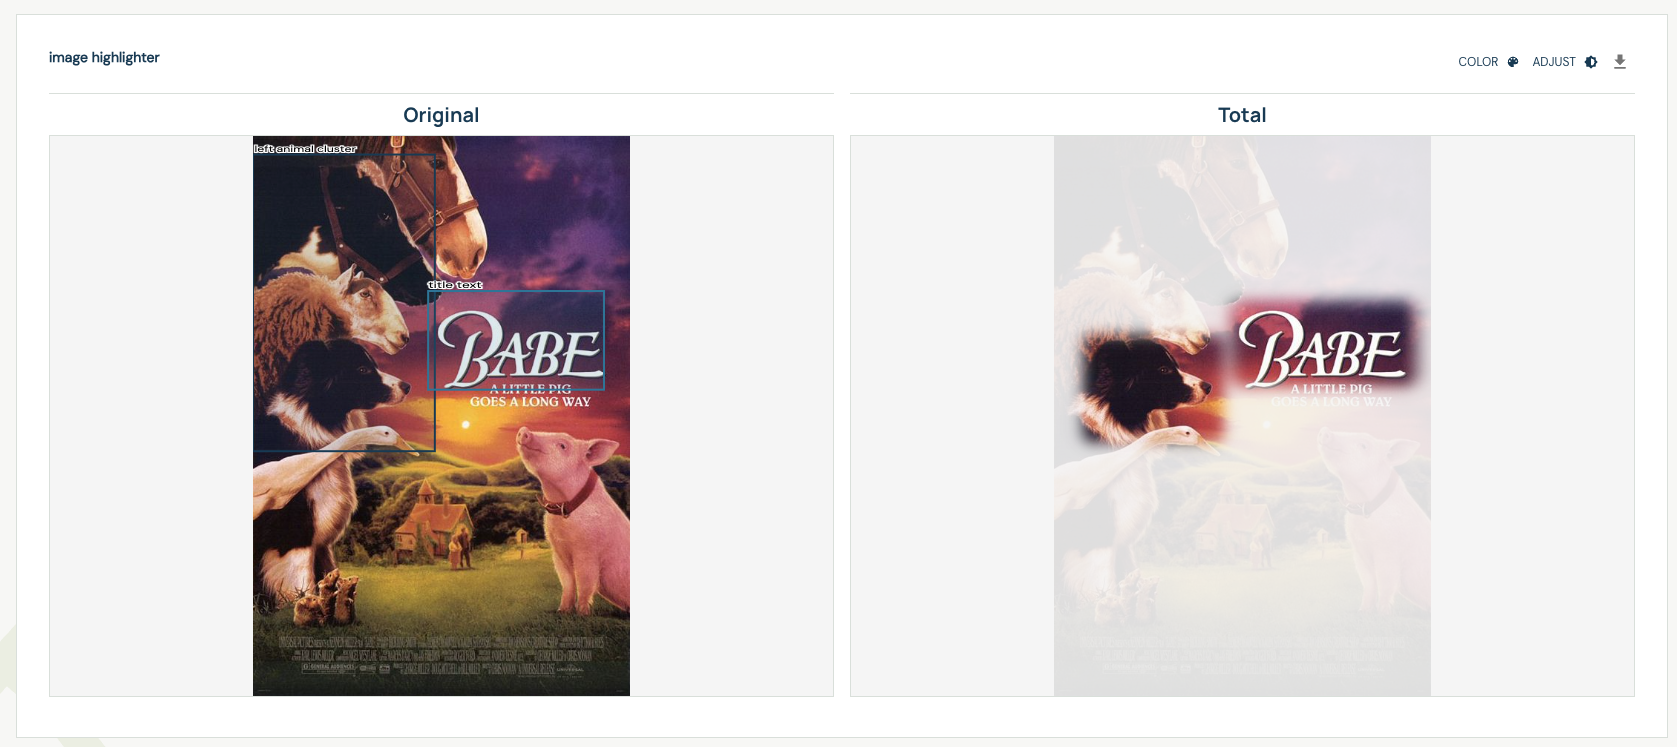
When the report contains several source images, use the Image page selector to move between them. The original, regions, question layers and comparisons change together. A question repeated against different images keeps the appropriate image-specific results.
Click an image to open a larger view. Use the color picker to adjust a question's color or switch to a mask view. Adjust changes the shared opacity and background-image contrast. These appearance controls help you inspect the results; they do not change the saved answers or region assignments.
Heatmaps and region results
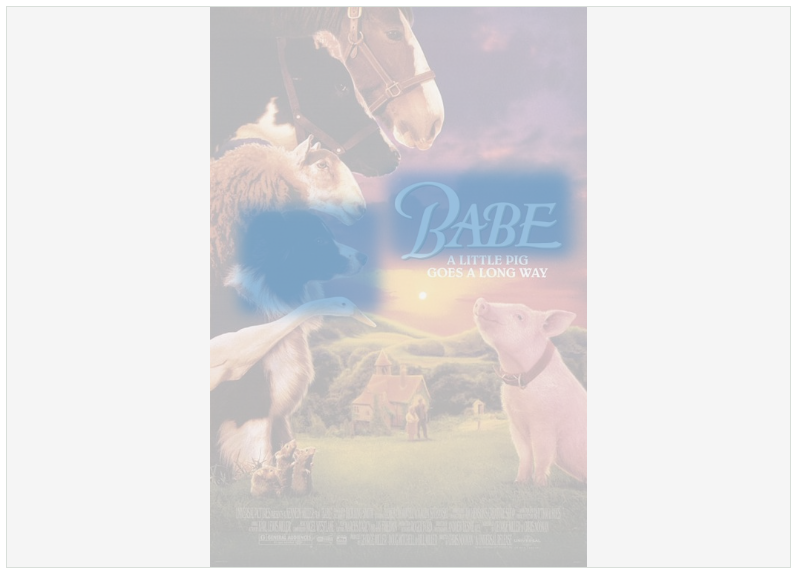
Heatmaps show spatial coverage of the selected areas, accounting for the report's filters and weighting. Overlapping selections from one respondent do not multiply that respondent's contribution to the same area.
AI-assisted region discovery uses the original image, question wording and an aggregate highlight map to identify meaningful areas such as a logo, headline or product. Questions using the same source image share a region set, making their results comparable. Each question still has its own answered base; discovery does not merge the questions' response bases.
A respondent's selection is assigned to a region when at least half the selected rectangle lies inside that region. One rectangle can match more than one region. Selected areas that do not match a named region are retained as Other. Each respondent counts once per region, so region percentages need not add up to 100%.
An accepted empty answer or explicit opt-out contributes to that question's answered base without adding selected area. Missing or skipped answers do not have a saved response. A missing or zero base is not evidence of a measured 0% result.
These are respondents' deliberate selections, not measured gaze. Read region labels alongside the original image and question wording; AI-assisted coding does not establish why a respondent chose an area. Use cropped follow-up questions when you need their explanation.
Pending coding and unavailable data
A raw heatmap can appear while region coding is pending. Region outlines and coded results become available after discovery completes. If coding fails, the report can retain its raw heatmap and show an error; do not interpret that state as an image with no selected areas.
A completed discovery can also return no named regions. In that case, selections are retained as Other. Refresh the report after its dataset has finished updating when you need the latest coding and answers.
Download visual results
Use an image's Copy image or Download image action to copy or save a PNG with its current display settings. Click the image for the enlarged preview when you need to inspect it before downloading.
The report's Download all images action creates a ZIP of the displayed image panels for the currently selected source image. It does not combine every source-image page into one download. Switch to another Image page and download again to obtain that image's panels.
For respondent-level analysis, use image-highlighter data exports. Raw exports retain original geometry; coded exports use the derived region responses.
Secure images and report access
Image analysis uses the source original, including images uploaded as Secure. Authorized reports can display those originals and use them to compose PNG and ZIP downloads. The ordinary Media-table restriction on Secure original downloads does not prevent this report workflow.
Secure respondent viewing and report access serve different purposes. Give report access only to researchers who should be able to see the original stimulus and share the resulting images. See Media security for upload and respondent-viewing choices.